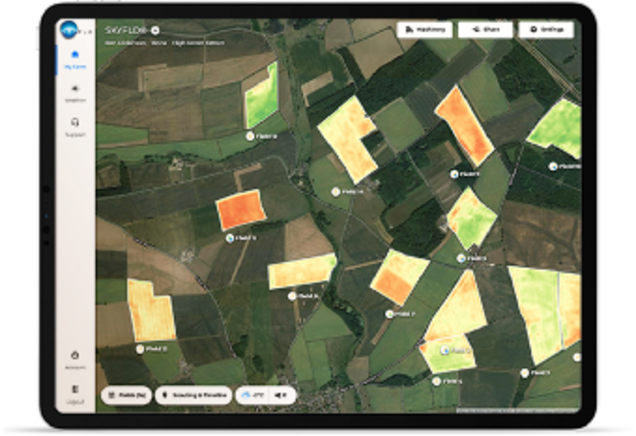
SKYFLD®- All important information in one place.
Biomass maps give an overview of crop health and a visual indication of heterogeneity in the field and across your farm. As a result you are always aware of the status of your crops, and can prioritise areas for further investigation or scouting. In addition to being a great indicator of crop health, SKYFLD biomass maps can be used as a base for variable rate application cards in conjunction with Yield & soil Maps uploaded by the user.

Overview of plant
health & variation

Definition of
different zones

Variation of inputs
to plant needs

3-year History as
standard
Creating biomass maps is easy
01
Create a
field
Draw or upload your
field shape
02
Download
the map
Biomass map downloads automatically
03
Auto
Updates
New and updated maps
added regularly
Insights that pay off
From the biomass map you can read the vitality, i.e. the health, of your plants. This is not only useful for monitoring the growth process, but also for evaluating the current condition and as an indicator to predict harvest. Also obverse biomass changes in different parts of your field that can indicate soil quality or water holding capacity.
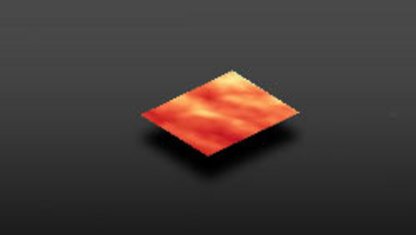
Poor vitality
0% - 25% snow, dead plants, water spots
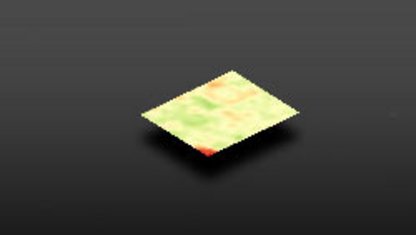
Medium vitality
25% - 33% plants, adapted stand management
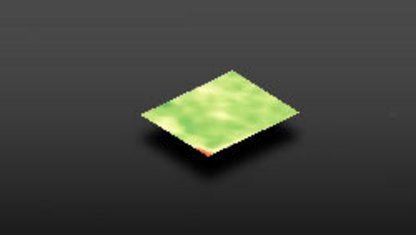
Good vitality
33 % - 100 % Healthy to very healthy plants
Scouting and sharing
- With the SKYFLD scouting you can record and categorize notes, upload supporting documentation and tag colleagues, partners or advisors to facilitate the sharing of information. Each individual note can be saved as an overall comment, as a pinned location, or as a drawn area within the field.
- With SKYFLD share you can ensure your trusted advisors have access to your scouting notes, your fields, or your whole farm. With three different access levels for sharing information, you are always in control of your information.
Data Upload
With SKYFLD, it is now possible to upload your field boundaries, documents and pictures to supplement your scouting notes, and to upload yield and soil maps. Also you can upload your shape or KML files, and then use the mapping tool to extract the data layers you want to work with. Existing soil and yield maps can easily be implemented within the variable rate application map creation process.

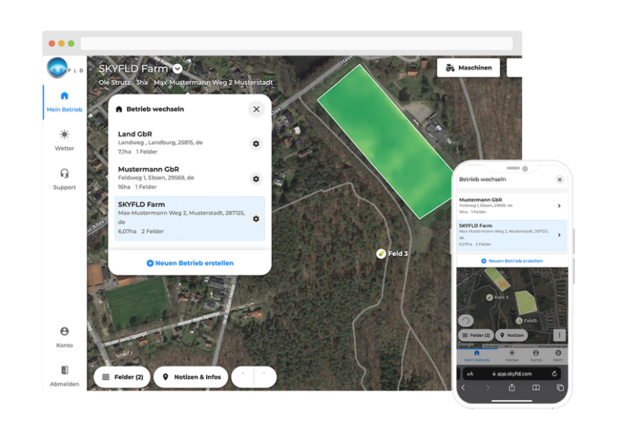
Farms and Seasons
With the new SKYFLD farms and seasons functionalities you can add in the history of your fields, start and end new seasons easily, and always have a record of your farm activities. You can add up to three separate farms as standard, meaning if you have different farm operations you can treat them as independent operations within your SKYFLD account.
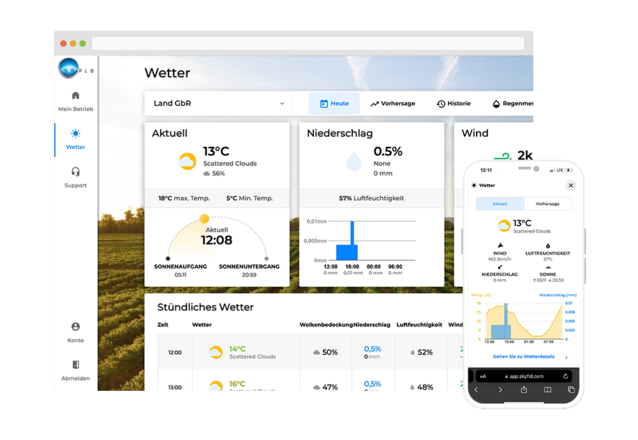
Weather Tool
Reliable weather forecasting is the cornerstone of all farming operations. With the SKYFLD Weather Tool you will have access to a localised weather forecast for each of your farm addresses. Alongside a 7 Day forecast, you also benefit from a live overview of the weather at each location, a 2 – year historical weather record, and a digital rain gauge. Utilising over 3 billion data points, SKYFLD weather gives you an accurate indication of Temperature, Precipitation likelihood & volume, daylight hours, wind speed, wind direction, Humidity, Dew Point, and cloud coverage.
Ready to use in 15 minutes:
Get 365 days for free
- Reduce farm input costs
- 3-year Biomass history as standard
- Optimize your crops